Rachit Arora
Azure Sentinel: Investigating Incidents
Mar 08, 2024Overview
Created a CTF for NSS, which involved Forensic Analysis, Cryptography and Privilege Escalation ( Docker Container Breakout).
- More information about the challenge and the badge here .
The first part of the CTF will be finding a Private key(.pem) , which will grant them access to a Linux virtual machine (VM) hosted in Microsoft Azure. They will then have a four-hour window to solve the challenges in the VM and the access would be given by Just-in-time (JIT) in Azure.
The CTF comprised of the following Elements -
Digital Forensics and Cryptography ( Steganography, Morse Code, Public Key Cryptography , basic encryption, hashing and validation techniques.) This will lead them to the Private key.
Once inside the VM, they will have to Docker Breakout to break-out of the container and then perform a Privilege Escalation.
Everything in the VM is being monitored by Microsoft Sentinel.
- A blog has been published here , analyzing the observations drawn from individuals attempting to compromise the VM.
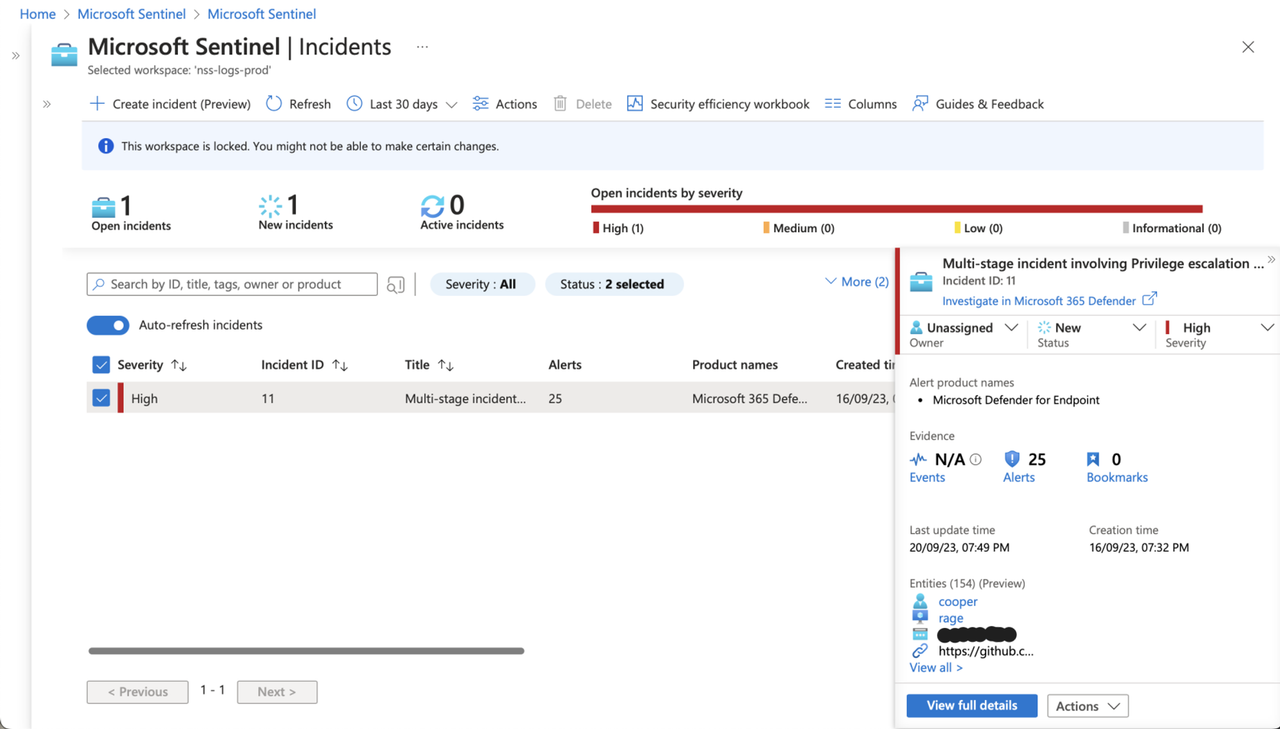
How does Incident page in Microsoft Sentinel help SOC?
Sentinel offers a robust case management platform that covers the entire spectrum of tasks involved in investigating, prioritizing, and handling security incidents.
It comes equipped with numerous features designed to support SOC teams, providing them with enhanced visibility and in-depth insights into the various aspects of incidents. These features encompass elements such as entity tracking, collaborative tools and standardized workflows, all working together to expedite the process from incident creation to resolution.
Understanding the interface
There are two key objectives sentinel aims to achieve:
- Obtaining a comprehensive understanding of the incident
- Minimizing the need to switch between screens or sources
As mentioned earlier, we want to ensure that all the necessary components and information are readily available in a single interface. As promised by microsoft, you can primarily remain on this screen and access nearly all the information and tools you require.
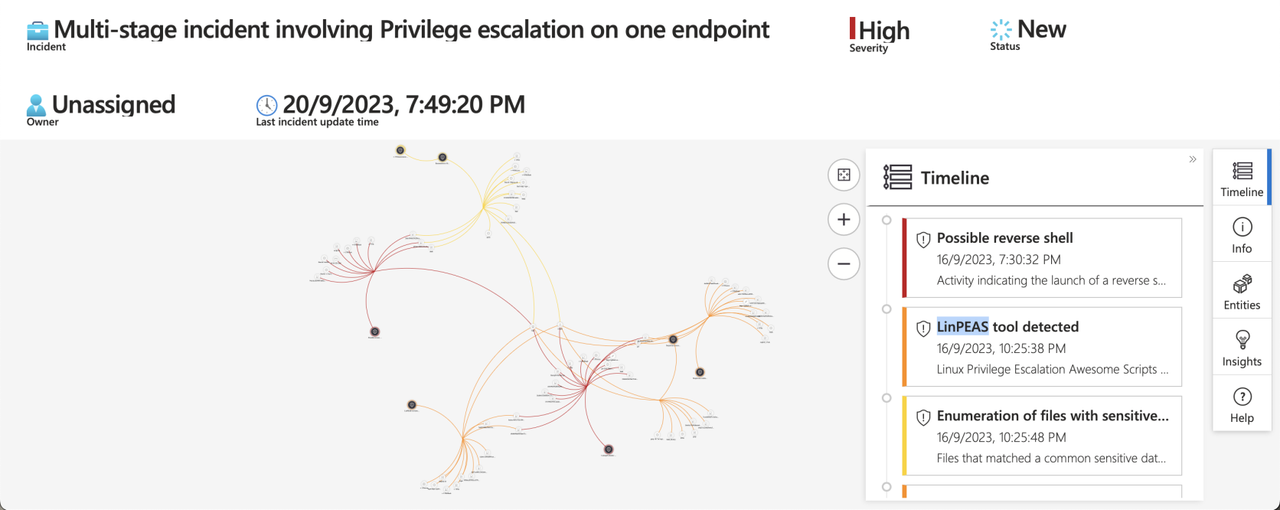
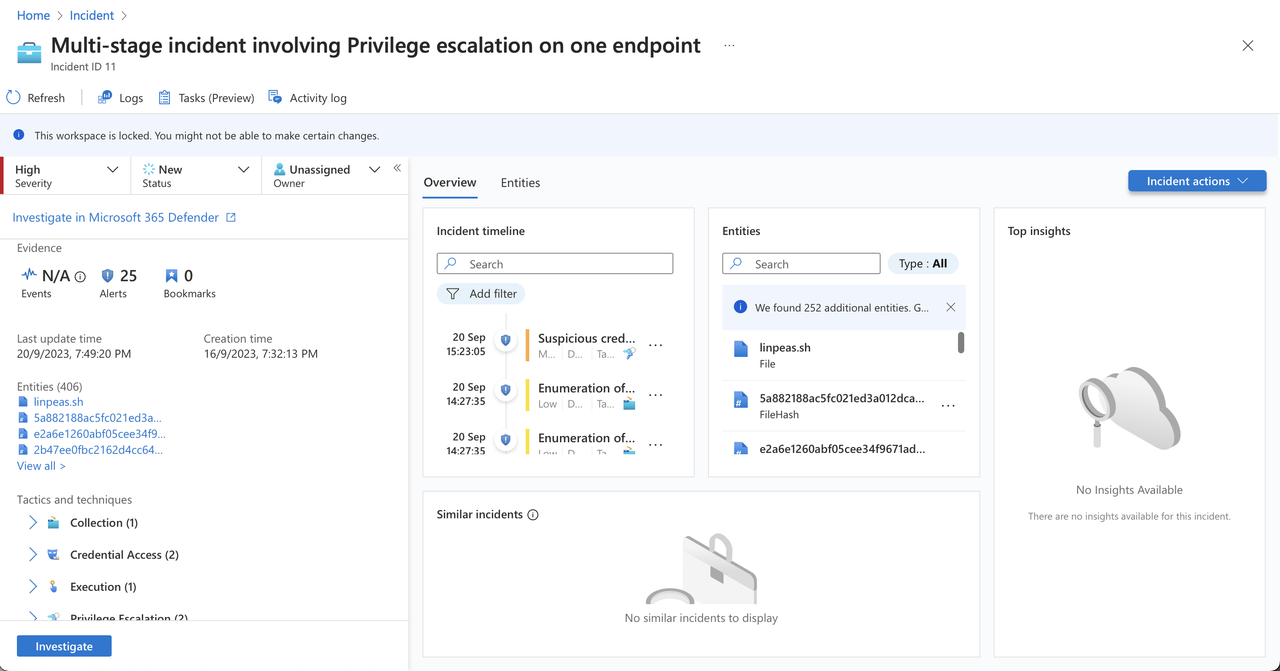
Incident Timeline → The Incident timeline widget shows you the timeline of alerts and bookmarks in the incident, which can help you reconstruct the timeline of attacker activity
Similar Incidents → In the Similar incidents widget, you’ll see a collection of up to 20 other incidents that most closely resemble the current incident. This allows you to view the incident in a larger context and helps direct your investigation.
Top Insights → In the Top insights widget, you’ll see a collection of results of queries defined by Microsoft security researchers that provide valuable and contextual security information on all the entities in the incident, based on data from a collection of sources.
Entities → The Entities widget shows you all the entities that have been identified in the alerts. These are the objects that played a role in the incident, whether they be users, devices, addresses, files, or any other types.
Activity Log → See if any actions have already been taken on this incident—by automation rules, for example—and any comments that have been made.
Logs → At any time to open a full, blank Log analytics query window inside the incident page. Compose and run a query, related or not, without leaving the incident.
Tasks → Tasks (Preview) to see the tasks assigned for this incident, or to add your own tasks.
Incident Timeline
Let’s begin with the incident timeline. As you are likely aware, an incident often comprises numerous security alerts, each providing only a fragment of the overall narrative. Each alert serves as a piece in this puzzle.
- The presence of a chronological timeline is essential as it helps establish a clear sequence of events, enabling us to discern potential causes and begin considering potential repercussions and mitigation strategies.
- Moreover, within this timeline, you can also include events that you deem pertinent to the incident but may not have surfaced as alerts for various reasons.
Entities
Now, shifting our focus to entities, it’s critical for the analyst to be able to recognize the components involved in the security incident. These entities could be users, IP addresses, URLs, hosts, or even file hashes.
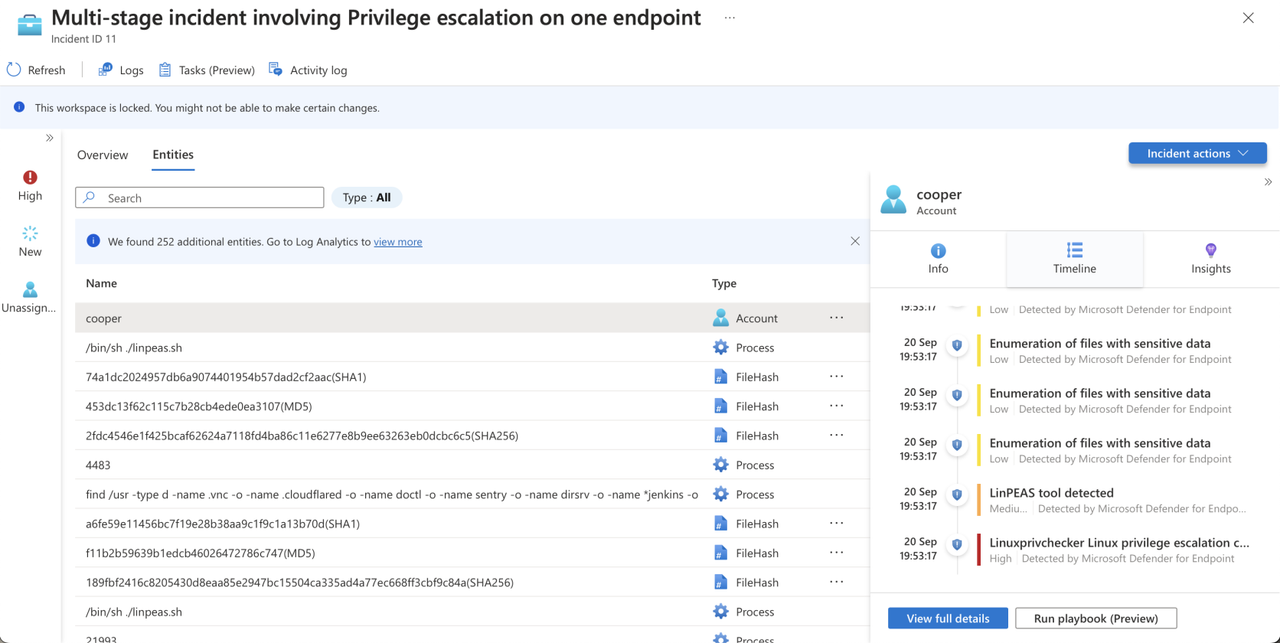
You can either click on an entity or select one to access the entities grid, which displays all incident entities that are both searchable and filterable. It provides entity information and an entity timeline, enabling you to view related alerts, activities, and anomalies. You can even incorporate alerts that are not originally part of the incident into it, enhancing the incident timeline with all relevant details.
We also have a compact timeline tab, as previously described, further reinforcing Microsoft’s commitment to minimizing the need for screen and tab switching, ultimately streamlining the investigator’s workflow for a more efficient experience.
Details Panel & Logs
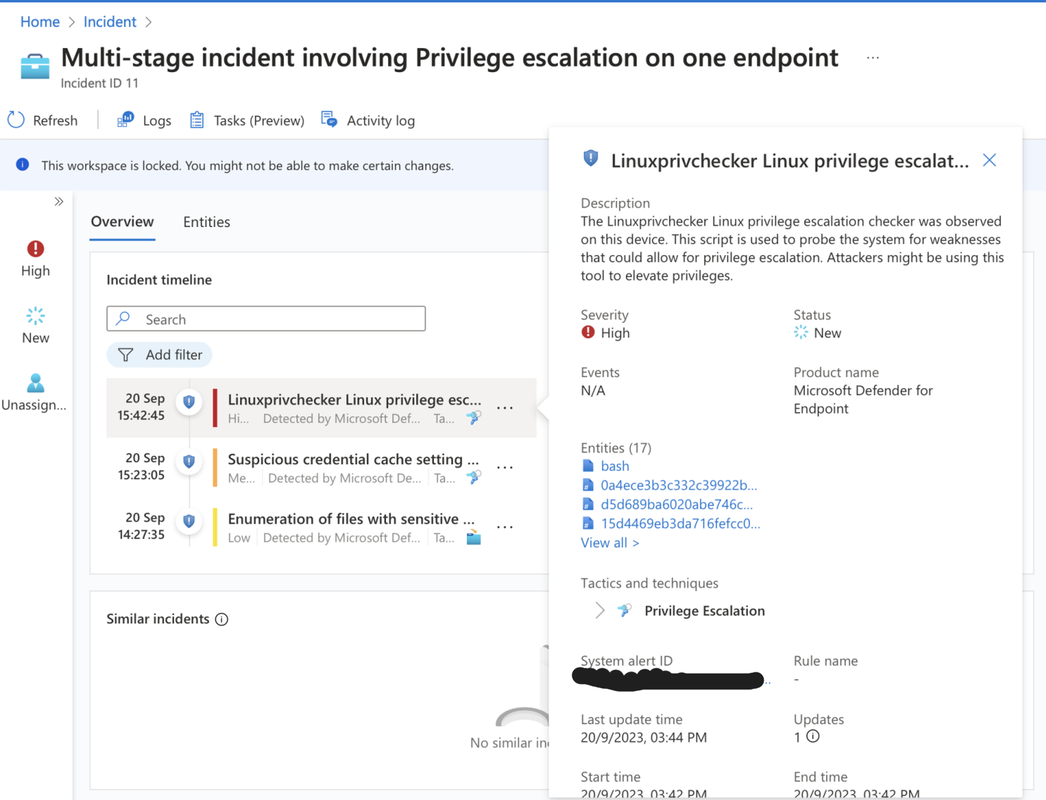
Now, over on the left, we the details panel,. Within this panel, you can find information such as events, alerts, bookmarks, entities, tactics, techniques, and even the most recent comment related to the incident.
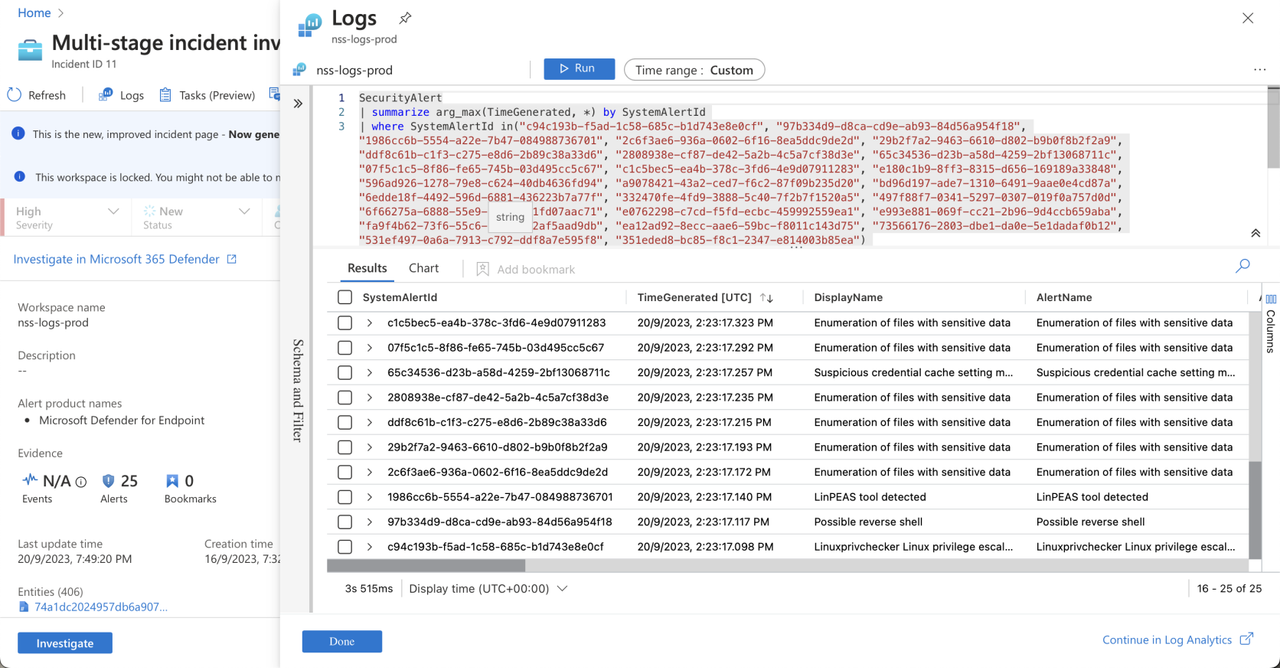
If you’re an analyst looking to view the alerts associated with the incident, you can simply click on the alerts, and it will open the log analytics window directly within the incident context.
This eliminates the need for any additional navigation, allowing you to easily access and examine all the incident’s alerts with their respective details.
Furthermore, you have the capability to perform log queries, and it’s not limited to just the elements within this specific incident. You can also conduct queries for items that are outside the scope of this incident.
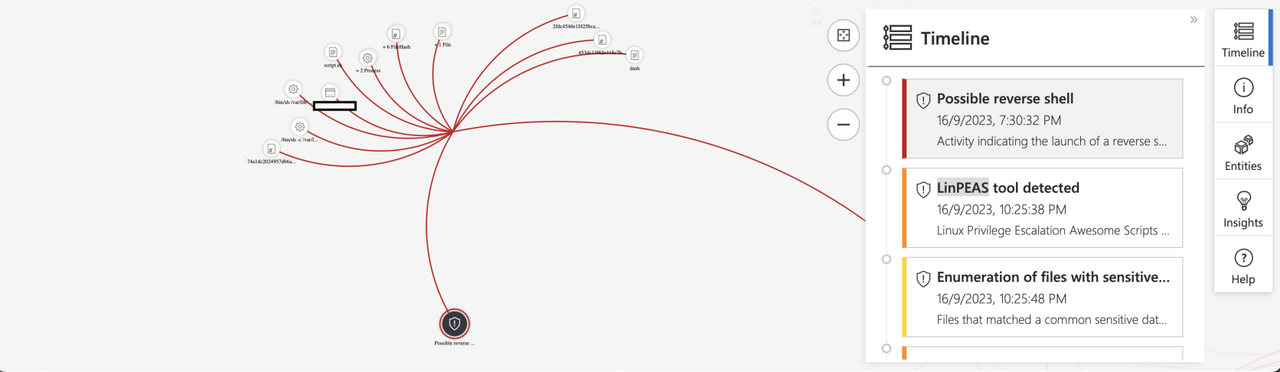
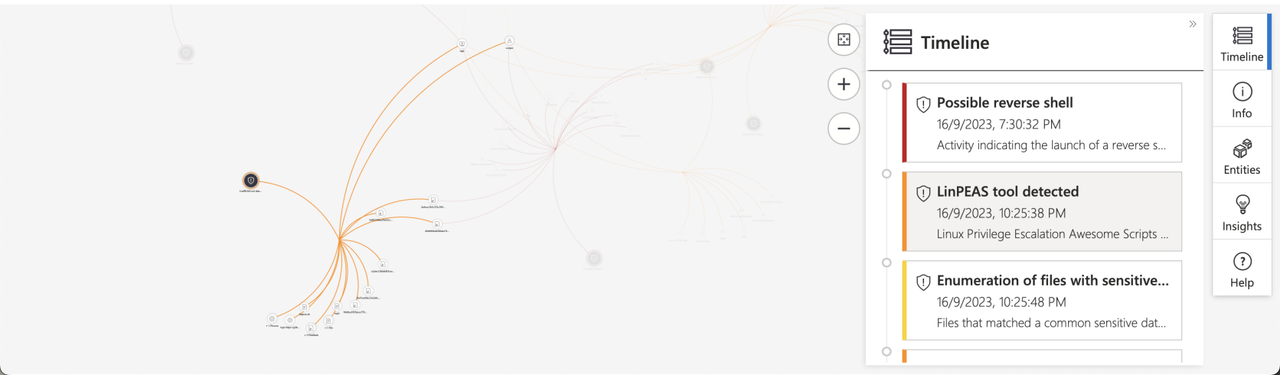
Investigation Graph
This enables us to visualize the connections between alerts and entities within the incident.
We can zoom in to observe the relationships between these entities and their connections to the alerts.
Analyzing a few alerts
“Reverse shell”
Linuxprivchecker Tool
Linpeas Tool
“Enumeration of files with sensitive data”
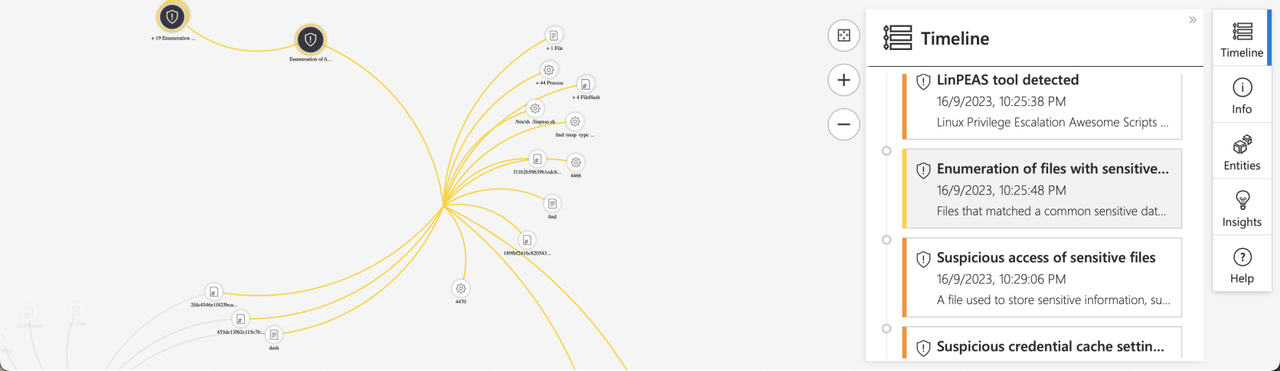
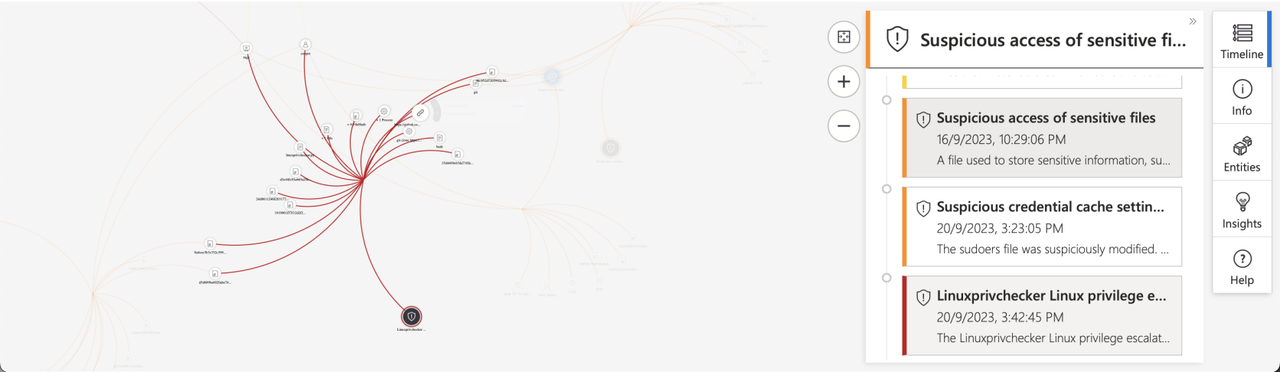
“Suspicious access of sensitive files”
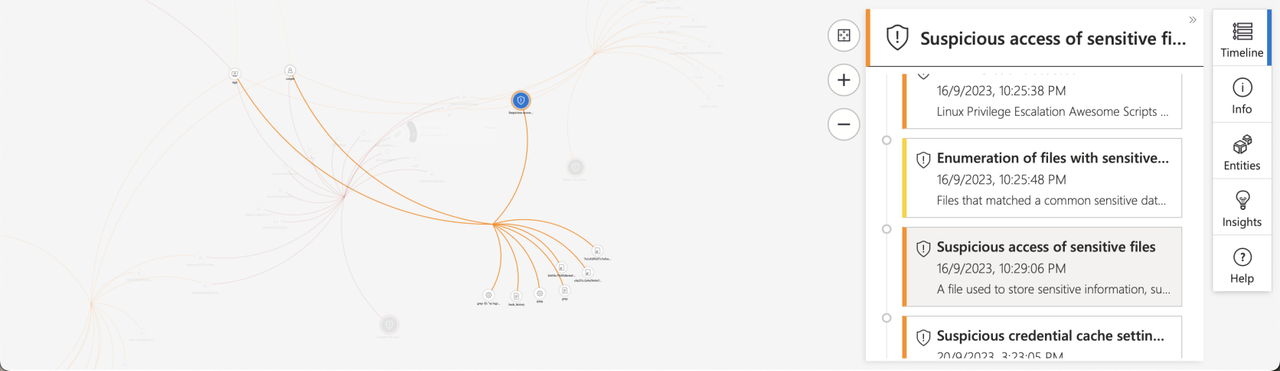
“Suspicious credential cache setting manipulation”

There’s a wealth of information that can be further explored within these graphs, and an even broader range of insights available in the log analytics workspace, but that’s a topic for another blog post.
Have any questions
Do you have any questions? Feel free to reach out to me on twitter or on LinkedIn.