Rachit Arora
GNU Debugger- Fundamentals
May 09, 2024This blog will guide you through the foundational concepts of gdb,nm,strace, including how to disassemble a binary, modify it, and understand the use of breakpoints, as well as conditional breakpoints. Using Intel Syntax
Symbols
Debugger symbols are a set of data that provide details on variables and functions within a binary file, allowing a debugger to interpret the binary more effectively. These symbols can either be integrated within the binary itself or stored in a separate file.
Debugging symbols must be specified during the compilation process. There are various file formats for these symbols, including DWARF 2, COFF, XCOFF, and Stabs.
In the GCC compiler, the -g option is used to generate debugging information, and the –ggdb option is used to produce information optimized for the GDB debugger.
What do the symbol files tell us?
Symbol files provide information on various elements of a program such as the sources, global variables (excluding local variables), and the scope and details of functions. They also offer commands to display these symbols, aiding in understanding and debugging the program.
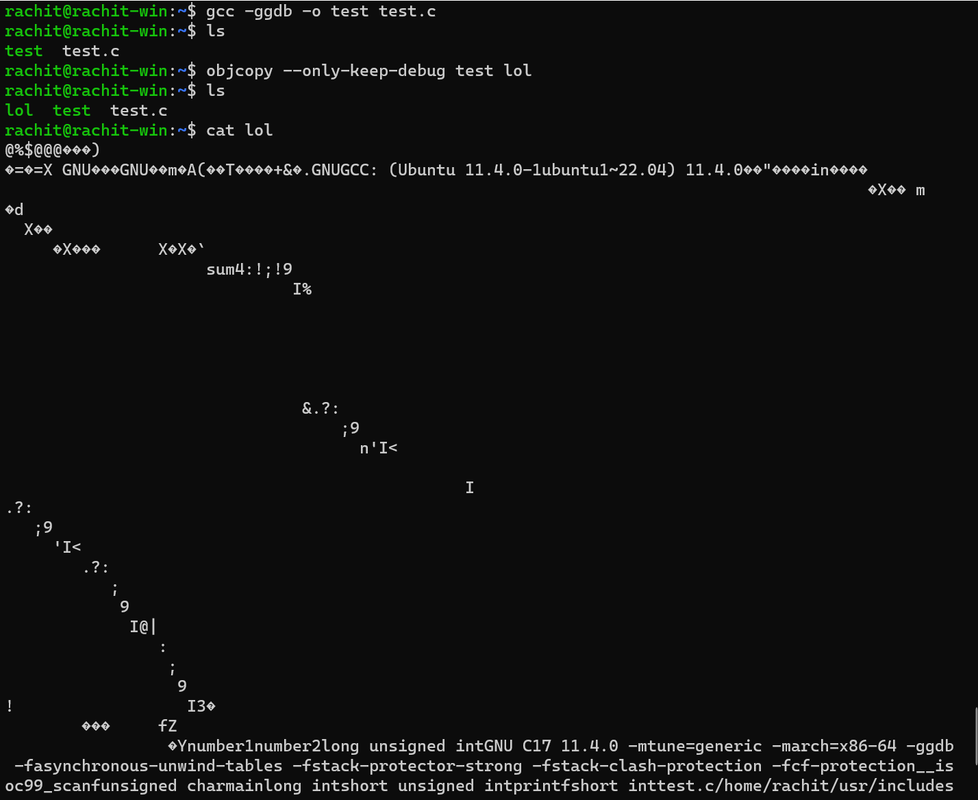
gcc -ggdb -o test test.c
Ripping Symbols off a binary
To extract only the debugging symbols from a binary file, you can use the objcopy utility with the –only-keep-debug option, followed by the source binary file and the destination for the debug file. Here is how you would write the command:
objcopy --only-keep-debug rip_from_binary debug_file
Example 1

Upon examining the binary file, we can observe all the detailed content at the bottom. The debug symbols remain present as they have not been removed.
we can strip out even the Non-debugging symbols like:
Stripping Symbols off a binary
To remove debugging symbols from a binary file, the strip command can be used with the –strip-debug and –strip-unneeded options, followed by the name of the binary file you wish to strip.
strip --strip-debug --strip-unneeded binary_to_strip
The symbols and functions have been removed. A developer would avoid distributing a binary with symbols included. They would execute this command to eliminate all non-essential elements from the binary, which would reduce the binary’s file size.
Adding debug symbols back to a binary
To add debugging symbols to a binary, you have two options:
- Embed the debug symbols directly into the binary file:
objcopy --add-gnu-debuglink=debug_file binary - Load the debug symbol file within GDB (GNU Debugger):
symbol-file file_name
Looking at the output:
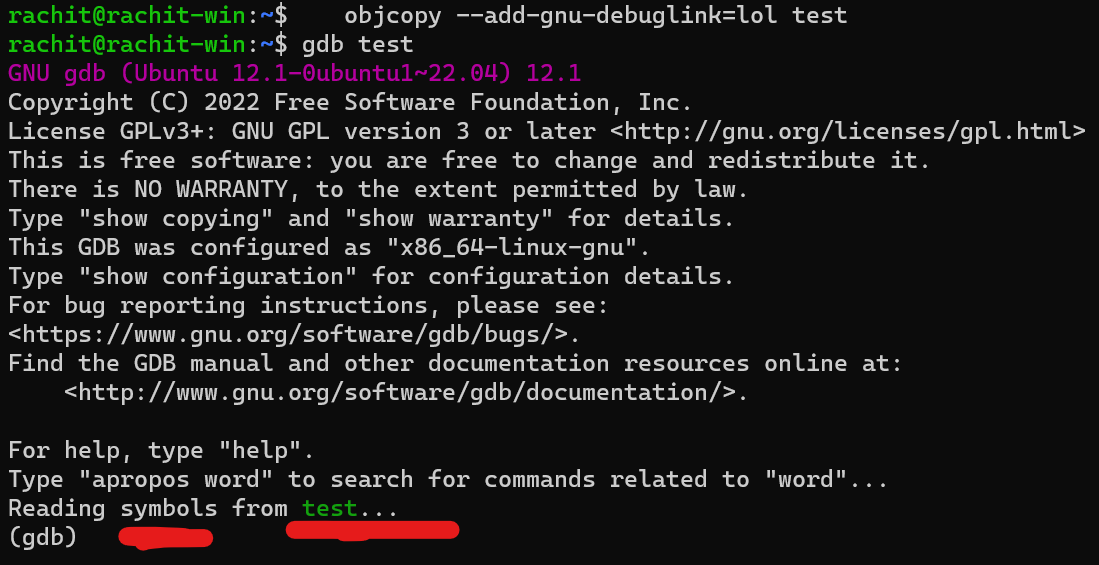
We see that the symbols are back.
NM
The nm command is a tool used in Unix and Unix-like operating systems for examining binary files, including libraries, compiled object modules, and binary executable files. It lists the symbols from object files if they are available. This can be particularly useful for debugging, as it allows you to see the functions and symbols within a binary, which can give you insights into whether your program is linking to the correct functions or if it is likely to have symbol-related errors.
To access the list of options and usage information for the nmcommand, you can use the following help command:
nm --help
Here are some useful nm command options:
- To display all symbols with their corresponding files, you can pipe the output to grep to filter for a specific function:
nm -A [file...] | grep function_name - To list symbols in numeric order of their addresses:
nm -n [file...] - For showing only external symbols:
nm -g [file...] - To display the sizes of objects within the file:
nm -s [file...]
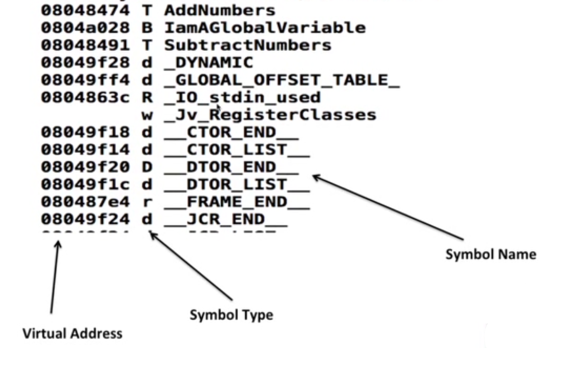
example 1
understanding a basic screenshot
Symbol Types
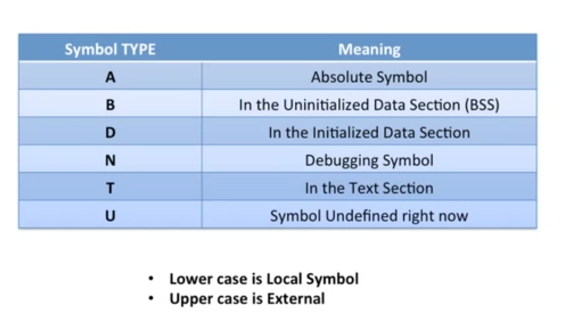
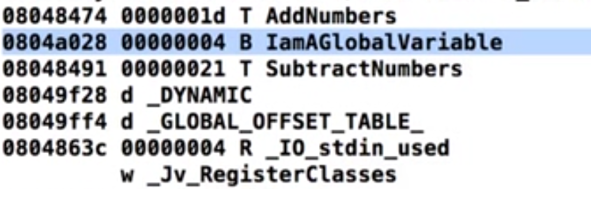
Looking at 2 screenshots which show you how exactly symbol works:
The 1st one here shows you uninitialized Global variable
Hence the symbol B
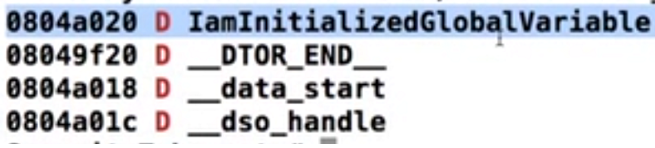
and
This one shows you the initialized Global Variable
Hence the symbol D
Strace
Pronounced as “S”“Trace”
Strace is a utility that helps you comprehend how a program communicates with the operating system by tracking all the system calls it makes, including the arguments passed, and provides extensive filtering options.
To trace the execution of a program:
strace executable_to_trace arguments
- Output the trace to a file using -o.
- Append timestamps with -t.
- Use -r for relative timing.
Strings
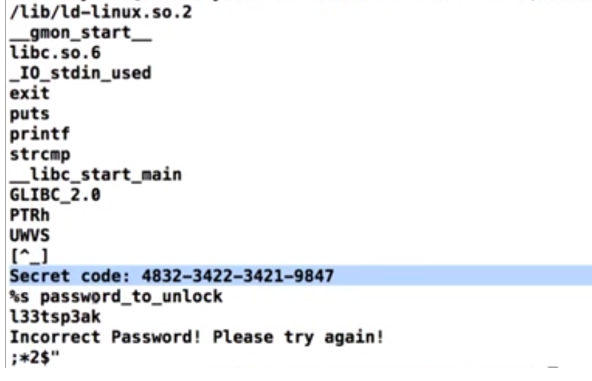
The strings utility in a program serves to display readable character sequences, which can be a vulnerability if the code is not well-written, potentially revealing private or confidential information.
To protect such sensitive strings, encryption or encoding techniques can be implemented, ensuring they are not easily discernible. Although ‘strings’ is not an advanced tool, it provides a solid starting point for initial program analysis.
Example 1
Basic GDB commands
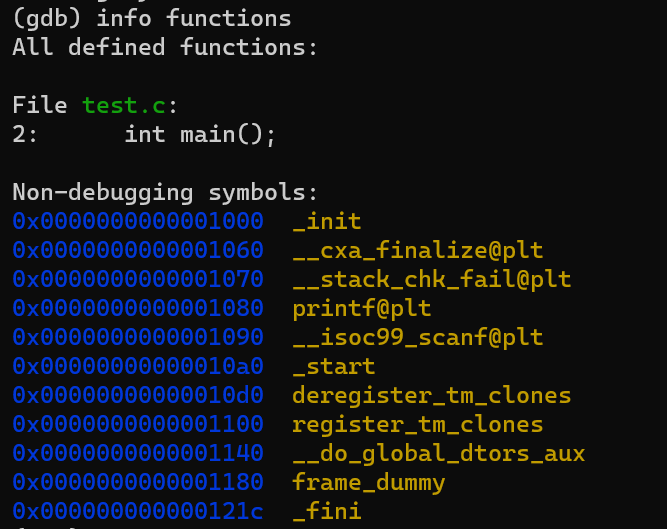
info functions
provides a list of all the functions in the source code of the program being debugged. This includes functions from the program’s own source files as well as those from any included libraries.
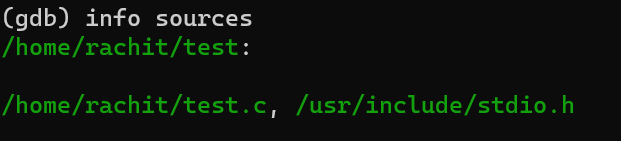
info sources
the info sources command lists the source files from which the program was compiled, helping developers to navigate through the code they are debugging.
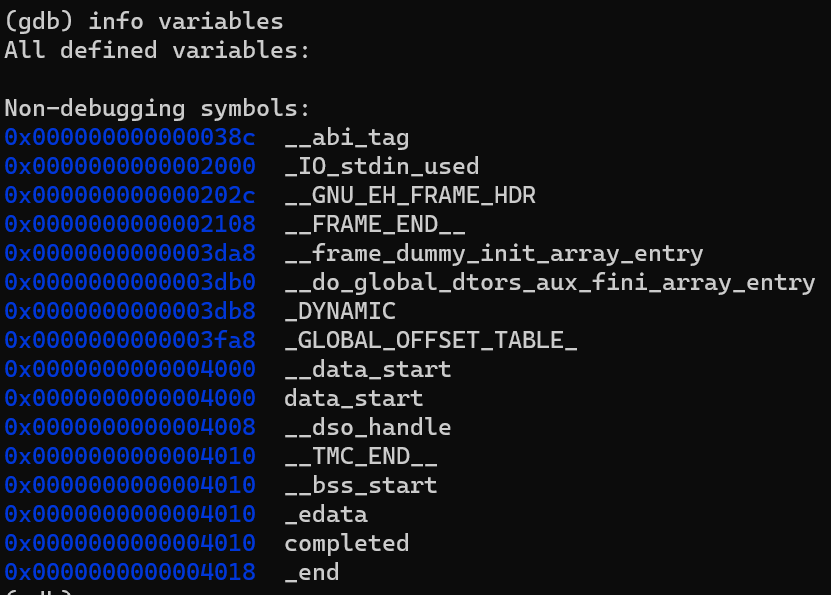
info variables
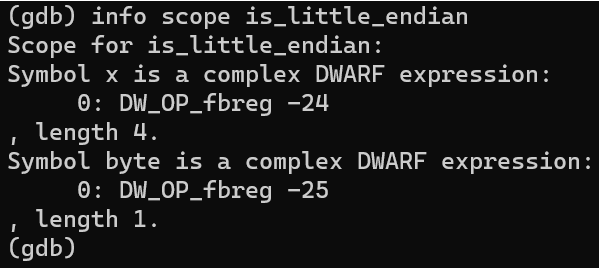
info scope
list all the symbols that are visible within the scope of a specified function or line of code
how do we look at local variables? we have to mention the scope
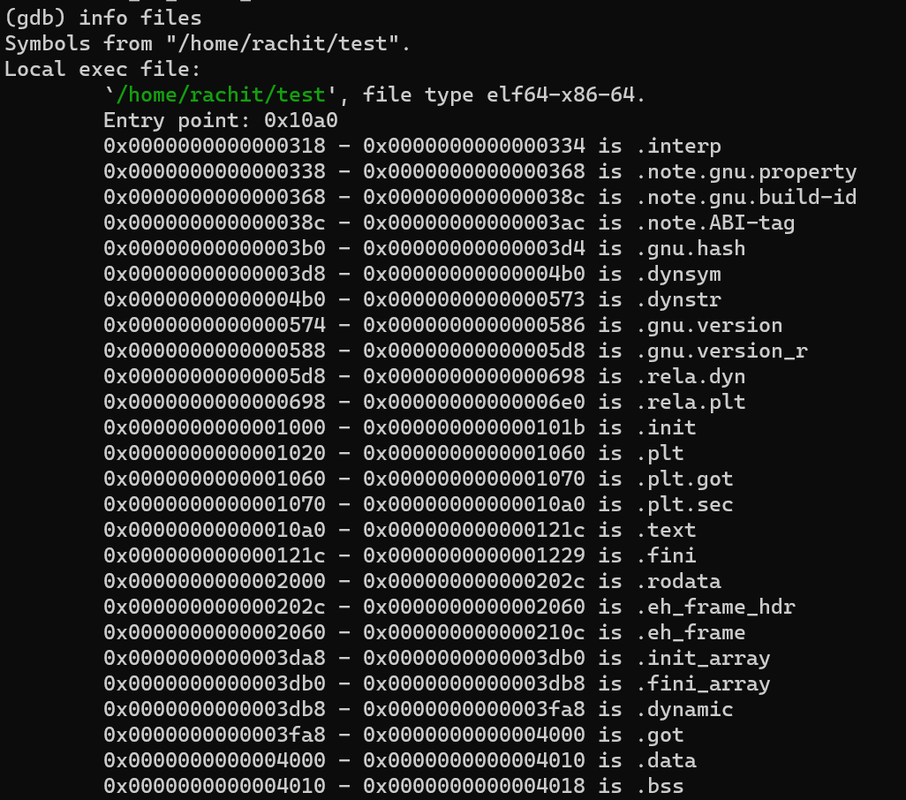
info files
provides detailed information about the files that the debugger is using. This typically includes the names of the source files, the associated program executables, and any shared libraries
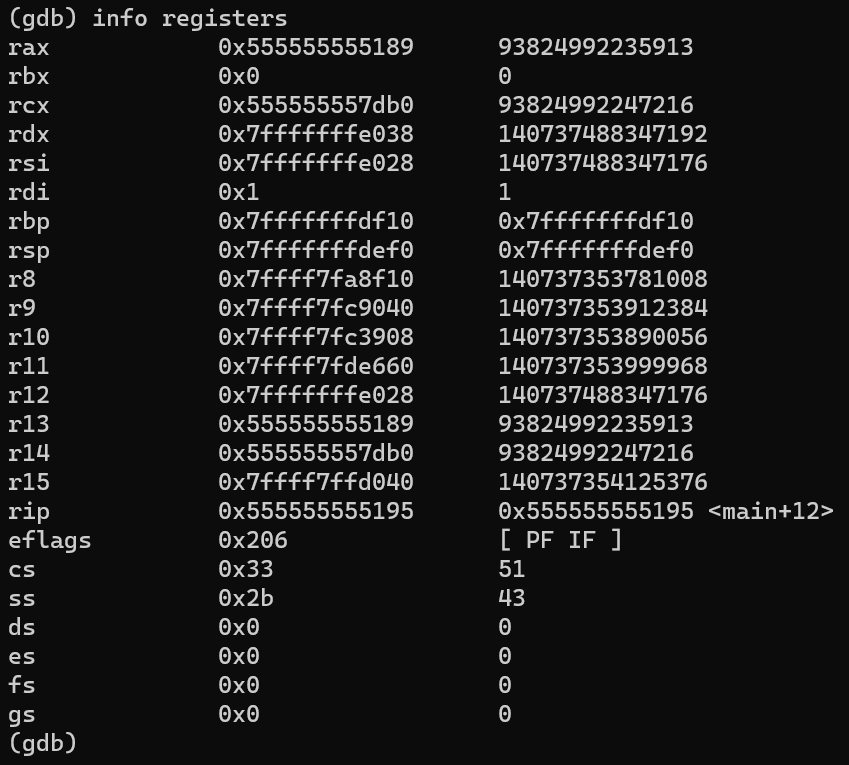
info registers
display the current values of all registers. It shows the state of the CPU registers, including general purpose registers, floating-point registers, and special registers
Breakpoints
- A breakpoint is a method for interrupting the running process of a program at certain points.
- It is activated when specific conditions are met, often right before executing a particular instruction that needs to be investigated.
- Once the program is paused, the debugger permits inspection and modification of the CPU registers, memory, and other data elements.
Setting up a breakpoint in GDB
- In GDB, you can set breakpoints at specific locations with several options:
- Use break address to set a breakpoint at a particular memory address.
- Use break function_name to halt execution at the start of a function.
- Set a breakpoint at a specific line in the code with break line_number.
(gdb) break main
Breakpoint 1 at 0x20a7: file test.c, line 398.
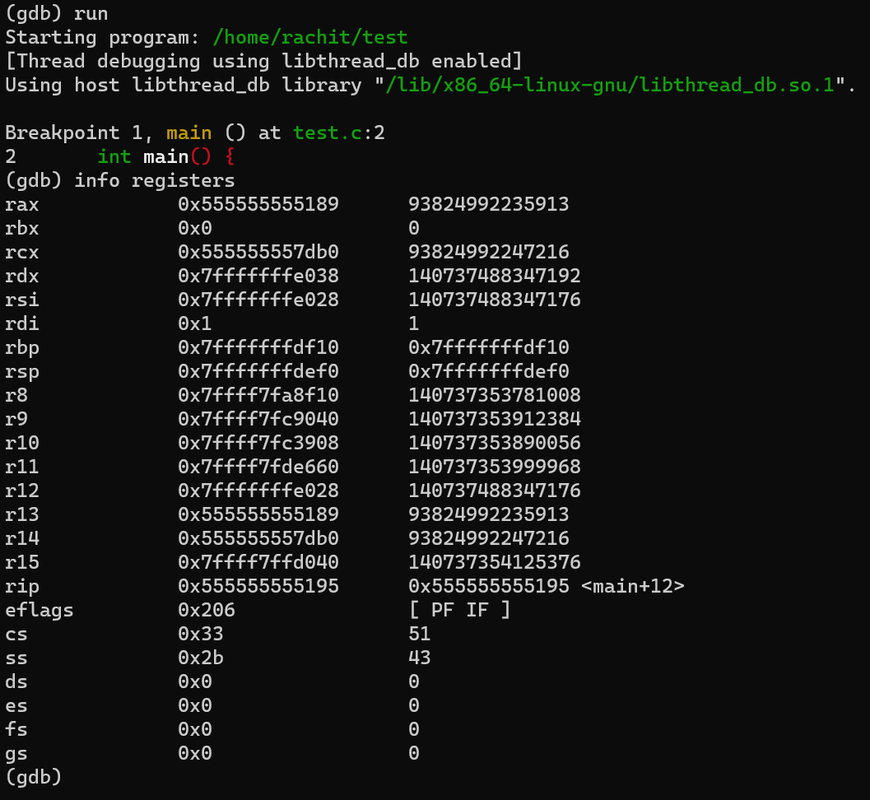
cpu registers at the current state where the breakpoint was hit
we can always set up another breakpoint, theres no restrictions
(gdb) break minimax
Breakpoint 2 at 0x14f5: file test.c, line 81.
breakpoint at a specific address
(gdb) break * 0x00000000000016e7
Breakpoint 2 at 0x16e7: file test.c, line 142.
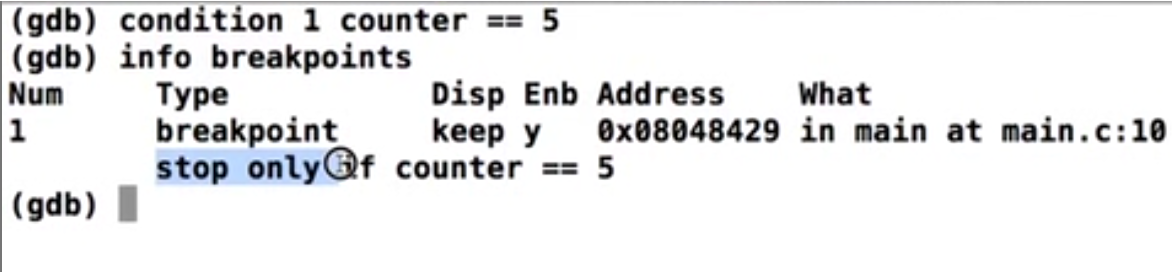
how do you look at breakpoints?
(gdb) info breakpoints
Num     Type           Disp Enb Address            What
1       breakpoint     keep y   0x00000000000020a7 in main at test.c:398
2       breakpoint     keep y   0x00000000000014f5 in minimax at test.c:81
we can enable/disable and delete breakpoints
(gdb) info breakpoints
Num     Type           Disp Enb Address            What
1       breakpoint     keep y   0x00000000000020a7 in main at test.c:398
2       breakpoint     keep y   0x00000000000014f5 in minimax at test.c:81
(gdb) disable 2
(gdb) info breakpoints
Num     Type           Disp Enb Address            What
1       breakpoint     keep y   0x00000000000020a7 in main at test.c:398
2       breakpoint     keep n   0x00000000000014f5 in minimax at test.c:81
(gdb)
enable 1 disable 1
(gdb) help x
Examine memory: x/FMT ADDRESS.
ADDRESS is an expression for the memory address to examine.
FMT is a repeat count followed by a format letter and a size letter.
Format letters are o(octal), x(hex), d(decimal), u(unsigned decimal),
  t(binary), f(float), a(address), i(instruction), c(char), s(string)
  and z(hex, zero padded on the left).
Size letters are b(byte), h(halfword), w(word), g(giant, 8 bytes).
The specified number of objects of the specified size are printed
according to the format.  If a negative number is specified, memory is
examined backward from the address.

Defaults for format and size letters are those previously used.
Default count is 1.  Default address is following last thing printed
with this command or "print".
The help x command in GDB provides information on how to use the x command, which is short for examine. The examine command is used to inspect memory in various formats and units. It allows you to display the contents of memory at a certain address with a specified format and size, which is very useful for debugging and examining the state of the program’s memory.
we can continue the program using continue
(gdb) continue
Continuing.

Breakpoint 1, minimax (board=0x7fffffffdec7, depth=1, isMax=true) at test.c:81
81              int score = evaluate(board);
Conditional breakpoint
Conditional breakpoints are a type of breakpoint that trigger only when a specified condition is true. They are particularly useful in scenarios involving loops or repetitive code. The conditions for these breakpoints can range from simple to complex expressions.
diassembling a function
(gdb) disassemble main
Dump of assembler code for function main:
   0x000000000000209f <+0>:     endbr64
   0x00000000000020a3 <+4>:     push   rbp
   0x00000000000020a4 <+5>:     mov    rbp,rsp
   0x00000000000020a7 <+8>:     mov    edi,0x1
   0x00000000000020ac <+13>:    call   0x1d29 <playTicTacToe>
   0x00000000000020b1 <+18>:    mov    eax,0x0
   0x00000000000020b6 <+23>:    pop    rbp
   0x00000000000020b7 <+24>:    ret
End of assembler dump.
Changing the flavour from AT&t to Intel
(gdb) set disassembly-flavor intel
The command x/i in GDB is used to examine the memory at a certain address as assembly instructions. This is useful for seeing the actual code that is being executed by the program at a given point in memory.
(gdb) x/i 0x00000000000020a7
   0x20a7 <main+8>:     mov    edi,0x1
Convenince variables
In GDB, you have the ability to define custom variables for holding data which can be used for various purposes during a debugging session. You can assign a value to a convenience variable like $i with a command such as set $i = 10. Additionally, you can allocate memory dynamically and assign it to a convenience variable with a command like set $dyn = (char *)malloc(10). Convenience variables can be used to store string values.
example, with $demo = “rachit”